The Progress Chart That Mistakes Every Pause for Failure
Build a progress chart that records decisions and changing methods alongside milestones, making it easier to choose a useful next move during a stalled stretch.
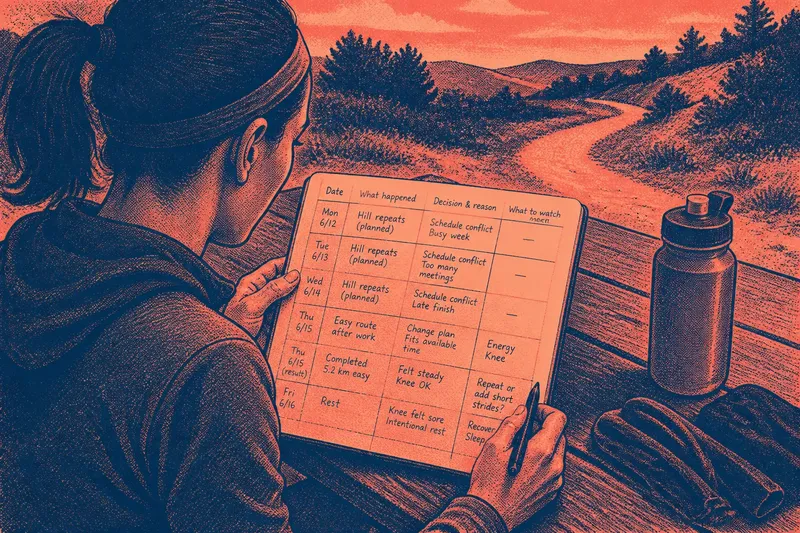
A runner opens a training notebook after missing a few sessions and sees blank boxes where completed routes should be. A progress chart can make those blanks feel like a verdict. Instead, a useful progress chart can distinguish an actual pause from a changed plan, a new observation, or a decision to seek help.
A blank space needs an honest label
A chart is only as useful as the distinctions it preserves. If every empty space looks the same, it cannot tell the difference between a rest day, a canceled session, and a practice that happened but did not produce a finished milestone.
Keep the record plain. Mark a day “rest,” “schedule conflict,” “waiting for feedback,” or “session completed; no milestone.” Add a brief note only when it helps explain the next decision. This makes the chart more accurate without turning every absence into a lesson.
For example, “no run” says what did not happen; “rest, knee felt sore” adds a reason that may affect the return plan. For pain or a persistent health concern, use common-sense caution and consult a qualified professional rather than relying on a chart to make a medical decision.
Track decisions that change the work
Milestones record outcomes, but a turning point often begins with a choice: change the route, ask a coach to review form, or replace a demanding session with an easier one. Writing down the choice and its reason gives the chart a record of judgment, not just completion.
A paper notebook, Google Sheets, or a whiteboard can hold four simple fields: date, what happened, decision and reason, and what to watch next. Keep observations concrete. “Walked the steep section” is clearer than “bad run”; “asked the coach to look at my stride” is more useful than “need to get better.”
Imagine a runner whose invented starting point is a notebook with three planned hill sessions marked incomplete after a busy week. She writes “schedule conflict” beside each, then changes the next entry to “easy route after work” because that fits her available time. Afterward, she records whether she completed the route and how it felt. The chart now shows a scheduling decision and an observable result, while leaving open whether the new plan should continue.
Use evidence to decide what changes next
Not every adjustment deserves to become a permanent rule. A chart should help separate a one-off observation from a pattern worth discussing or acting on. The useful question is not whether the line is rising; it is what the record supports doing next.
- Check whether the session happened. If it did, record the activity and a concrete observation; if it did not, mark the reason plainly and choose a realistic return point.
- Check whether the plan fit the available time. If it did, keep the schedule for now; if it did not, choose a shorter or differently timed session.
- Check whether the same obstacle appeared again. If it did, ask a coach or instructor for input; if it did not, record it as a single occurrence rather than changing the whole plan.
- Check whether an adjustment had an observable result. If it did, note the result and decide whether to repeat the adjustment; if it did not, keep the question open and avoid claiming it worked.
- Check whether the entry reflects rest or difficulty. If rest was intentional, label it as rest; if the person wanted to practice but felt stuck, name the obstacle and choose a specific source of help.
- Check whether the chart is making the learner feel judged. If so, remove ranking language and write what happened; if neutral notes still feel unhelpful, simplify the chart or take a break from reviewing it.
Choose a format that fits the pursuit
A runner may want a dated notebook with route and condition notes. A woodworker might use index cards for project decisions, while a student could use a spreadsheet to track questions for an instructor. The format matters less than being able to find the decision and its reason later.
Use columns for recurring sessions, cards for work with distinct stages, or a short timeline when plans keep changing. Avoid turning observations into scores unless a score answers a real question. “The downhill section felt harder today” leaves room for context; a bare rating can conceal it.
Keep uncertainty visible. “Maybe the shorter route fits this schedule” is a record of a possibility, not a conclusion. If later entries point the same way, the learner can decide whether to keep the adjustment or ask someone knowledgeable for advice.
What should a progress chart show besides milestones?
What belongs in a chart after an unfinished session?
Record what happened, what interrupted the work, and any decision that followed. If no session took place, label the pause rather than filling the space with a made-up achievement.
Should I record decisions or just completed work?
Record both when they help answer different questions: completed work shows what happened, while decisions explain how the plan changed. A short reason can help distinguish a considered adjustment from a random variation.
When should I review a progress chart?
Choose a natural boundary, such as the end of a practice week or project stage. Look for an actionable pattern or an unresolved question, not a smooth line of progress.
What if reviewing the chart feels discouraging?
Replace judgments with observations, and remove fields that invite unhelpful comparison. If the chart still adds pressure without helping with a decision, simplify it or stop using it for a while.
Let the chart guide a decision, not issue a verdict
At review time, read the entries and ask what choice they support: continue the approach, alter one part, ask for feedback, or rest. If the notes do not support a clear answer, the next useful entry may simply record what to observe.
A progress chart is most honest when it can show a missed session without disguising it and a changed decision without exaggerating it. That makes a progress chart more than a row of milestones: it becomes a record a learner can use to choose what to do next.